Radiation Measurements
Fig. 1. GMC-300E
When energetic particles in the solar wind impinge upon the Earth’s magnetosphere, they change the trajectories of the particles. Some of these magnetospheric and solar wind particles precipitate down to lower altitudes along the magnetic field lines. These particles collide with the oxygen and nitrogen atoms in the Earth’s atmosphere and when these excited atoms return to their ground state, they emit photons causing the magnificent displays that we typically associate with the aurorae.
While aurora usually occur in the 100 km – 300 km altitude range, during periods of intense activity, we expect it to be accompanied by an increased flux of protons, electrons and X-rays in the lower reaches of the atmosphere. We at Night Crew Labs wanted to see if we can measure this change in the radiation level through our balloon platform and to study if the radiation numbers are correlated with the direction of aurora in the night sky.
Instrument
To measure the radiation levels, we used the GMC-300E digital Geiger counter (Fig. 1). It is a light-weight, low-cost module which can log approximately 10 hours of radiation data in its internal memory, with a cadence of 1 sample per second. It contains a Geiger Muller tube which measures the flux of particles through the gas breakdown and avalanche mechanisms. While simple in its design and operation, this device does not differentiate between alpha particles, beta particles, gamma rays and X-rays. Therefore, it measures the overall radiation levels and presents the data in terms of counts per minute (CPM).
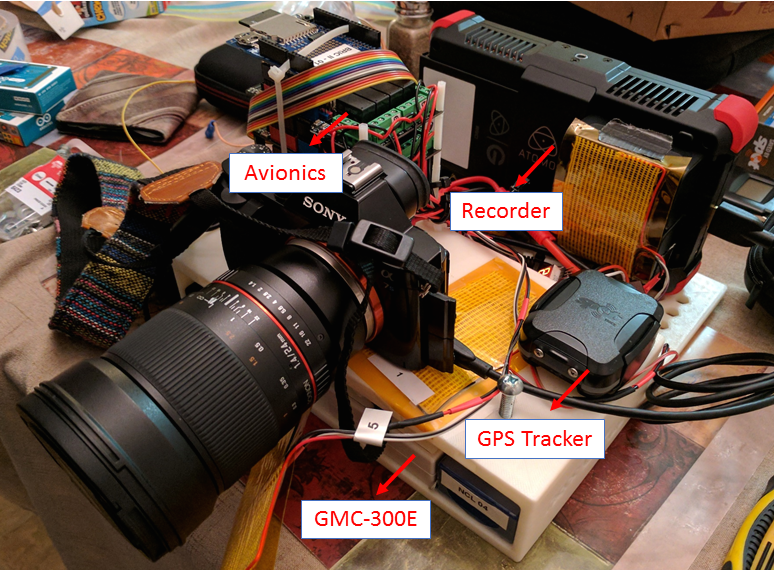
Fig. 2. Flight configuration showing the GMC-300E
Flight Data
Fig. 3. CPM and altitude vs time
The GMC-300E was flown during our night launch in Alaska along with all our imaging equipment, the flight avionics and recovery systems, as shown in Fig. 2. We did not have a means to remotely control the operation of the GMC-300E or to pre-set the time duration over which data was recorded. Since it stored all its data in a ring buffer, if the payload was not recovered within 10 hours of launch, the flight data would be overwritten. As luck would have it, the presence of the large video recorder for the Sony A7S camera interfered with the operation of the GPS tracker and this delayed our entire recovery process. We were only able to recover the payload almost 21 hours after launch. But fortuitously, probably due to the low temperatures, the battery of the GMC-300E died 10.5 hours after launch and this prevented the flight data from being overwritten. The data recorded by the instrument over the course of its flight is shown as a function of time in Fig. 3.
The balloon was launched at t=0 and burst at an altitude of ~24 km after a flight time of ~55 minutes. In the beginning, the radiation levels are below 50 CPM but as the balloon gains altitude, the CPM rises consistently over 2 orders of magnitude. Around the 40-minute mark, the radiation level reaches its maximum at an altitude of ~19 km and starts decreasing. At the 49-minute mark, just a couple of minutes before the balloon burst, the device malfunctioned and started recording very low radiation levels. The device also makes a sound whenever it records a particle hit. Based on the frequency of those clicks as heard in the video captured by the A7S camera, we know that the Geiger tube was measuring high levels of radiation beyond the 49-minute mark. But due to some error in its data logging electronics, it was not able to store its data correctly.
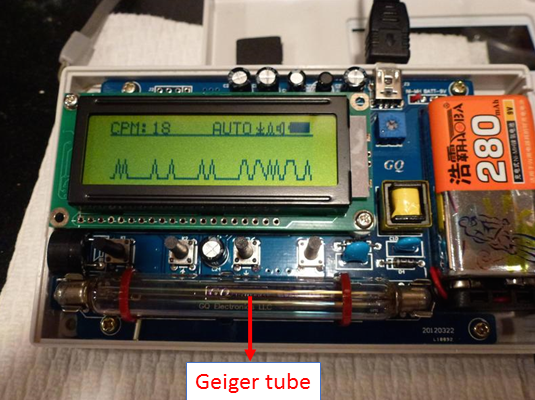
Fig. 4. Geiger tube inside the GMC-300E (outer casing removed)
Discussion
There are two primary factors that determine the variation of radiation flux as a function of altitude. As we go up, the particles have to penetrate through exponentially thinner atmosphere and this leads to a steady increase in the measured radiation levels. But a bulk of the radiation measured by the detector is made up of secondary particles that are created when the primary particles from the solar wind and Earth’s magnetosphere collide with the constituents of the Earth’s atmosphere. As the altitude increases, the likelihood of collisions with the neutral atoms decreases, leading to a decrease in the population of secondary particles. These two competing factors give rise to the observed radiation profile. During the first 40 minutes, the opacity of the atmosphere dominates, leading to a steady increase in the radiation levels. After ~19 km, the reduction in the flux of secondary particles is the dominating factor, leading to a decrease in the overall measured flux. At an altitude of ~19 km, we obtain the maximum radiation value, also known as Pfotzer maximum, named after the German physicist who discovered this phenomenon.
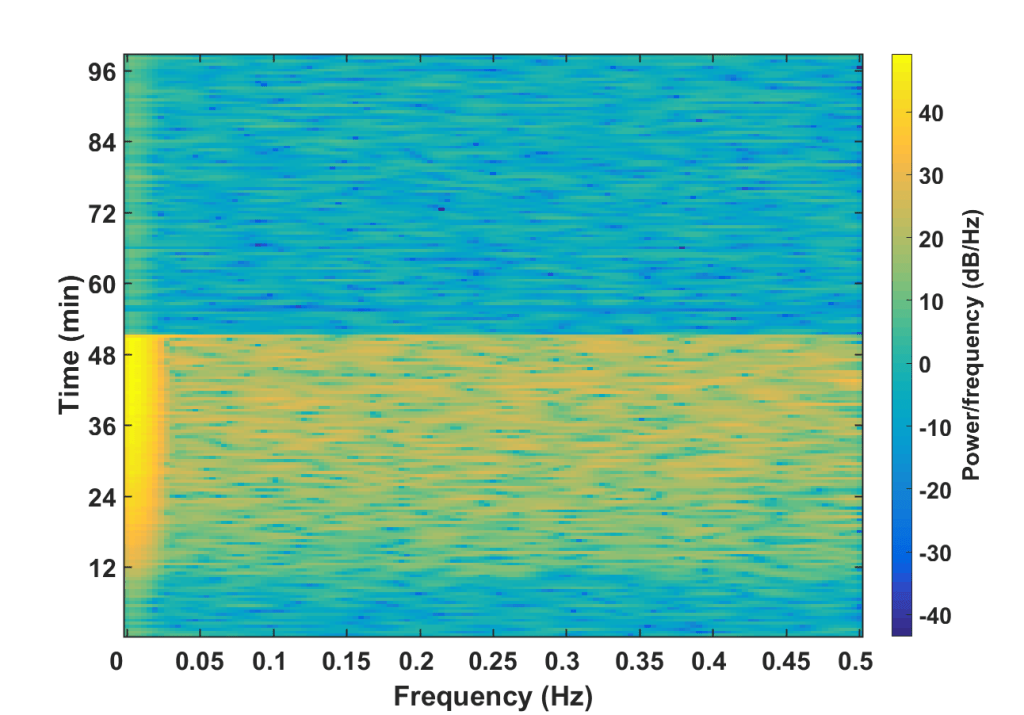
Fig. 5. Spectrogram of flight data
We were also interested in studying if the high auroral activity is correlated with an increased flux level at the balloon altitudes and if there is a directional dependence in the measured flux. Unfortunately, the design of the Geiger tube in the GMC-300E (shown in Fig. 4 with the outer casing removed) makes it essentially an omni-directional instrument. However, the presence of the Sony A7S camera, the recorder and the flight batteries in the vicinity of the detector probably creates a differential shielding profile. Therefore, as the payload spins due to atmospheric winds, if there is a directional variation in the flux profile, it would pop up in the spectrogram of the measured data at a frequency corresponding to the typical rotation rate of the payload. The spectrogram was generated using 60-second Hamming windows with 50% overlap and is plotted in Fig. 5. Note that since the data was collected at the rate of one sample per second, the Nyquist principle limits the maximum frequency in our spectrogram at 0.5 Hz.
As we see in Fig. 5, there is no single frequency that stands out. This is not very surprising since we currently do not actively control the rotation of the balloon payload and depending on the wind conditions, this rotation rate can be highly uncertain. There is an intensification at the lower frequencies but that probably corresponds to the steady increase/decrease in the flux levels with altitude. There is a 2-minute period where the balloon spins at a nearly constant rotation rate of ~0.1 Hz, around the 47-minute mark. This is based on the video footage from the A7S camera. However, even after zooming into that region of the spectrogram, we do not observe any statistically significant correlation.
This tells us that either the increase in radiation levels during high auroral activity is not directional or our experimental setup is not good enough to capture this directional dependence. In the future, it would be useful to carry out similar measurements with scintillation detectors with a controlled aperture and directionality. We would also like to carry out measurements under conditions of low auroral activity to estimate the level of enhancement measured during our balloon mission in Alaska.


